For cloud services, highly available is something we know we need. But when a vendor says their service is highly available, what does that mean? When we talk about SLAs, people talk in 9s.
“Four nines” availability, or 99.95% available, is 52.6 minutes of downtime per year. We don’t see a lot of people advertising at 99.99% availability. The SCORM Cloud SLA, for example says 99.95%. AWS will give you a service credit for anything below 99.99% all the way down to 99.0% available. 99.0% available is 3 days, 15 hours and 40 minutes downtime per year.
So the question is, how available is Bright?

Note: We use external monitors on all of our infrastructure. The side-effect of this is we have nice historical data on how available our web services have been over time. But it also means that we are measuring network faults along with application downtime.
Let’s start with N. America.
What is being checked?
- This is a deep “application” check, that is, not just that the server is up, but the application is responding and is serving up something intelligible.
- In this case, our infrastructure is running in Newark and the monitors are in Dallas. So we are recording not just the application being down, but the network is down.
- The monitor here has checked every 5 minutes, which for the year, is 105,192 checks per year
Application Did Not Respond – North America/Newark – 2019
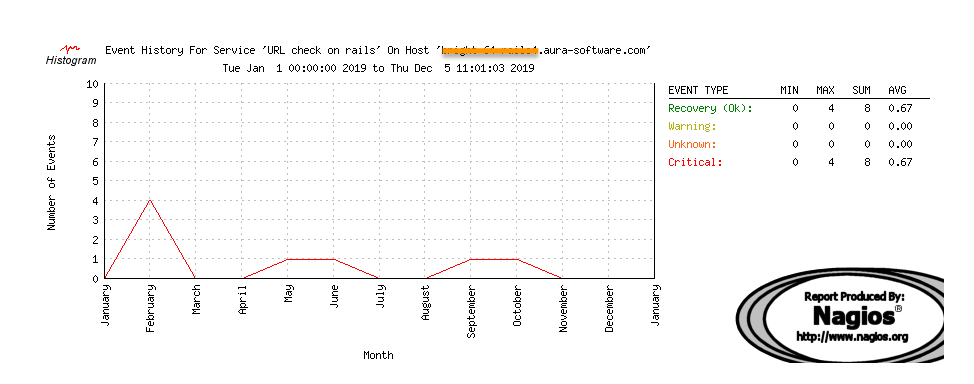
So how many failures is that? According to the external monitor, there were 8 times in 2019 in which the North American infrastructure failed its application check, including network failures.
If we just use simple arithmetic:
(8 * 5minutes) = 40 minutes downtime for the year.
That’s 99.9918% available from Dallas for 2019. There is no data as to whether the server was ACTUALLY down, or this was just a network fault. I would contend that the actual downtime was much less, but this is data, and we only can say what was measured.
I’ve quickly looked at 2018, and our European numbers and they are comparable if not better. I’ll post back here once I’ve got them…
How did we get it here
- 800+ automated tests as of 9.11.2019
- continuous integration
- 180 remote monitors
- “complete” replica production environment
- automated deployment
- if it breaks, we don’t just fix it, we fix why it broke in the first place
- get better, every day
- application instrumentation and remote performance monitoring
- browser side error trap